What's a Program Flowchart? | Definition & Examples
Contents
Definition of Programming Flowcharts
A flowchart is a graphical representation of various logical steps of a program. These expressions use several shapes, including the geometric ones, to show the step-by-step process with arrows while establishing a data flow. There are 21 different types of flowcharts, and a programming flowchart is one of them.
The program flowchart is a data flow that shows the data flow while writing a program or algorithm. It allows the user to explain the process quickly as they collaborate with others. These programming flowcharts also analyze the logic behind the program to process the code of the programming. The programming flowcharts can serve in different ways. For example, they can analyze the codes, visualize and work on them. They can also help figure out the application's structure to realize how a user navigates in a tool.
The programming flowcharts improve the condition and efficiency of work. The tool has four basic symbols that have code written on them for programming. They give commands like start, process, decision, and end, and these symbols are the crucial part of the programming flowcharts. They help in forming a relationship between various elements to describe the data flow.
Benefits and Drawbacks of Programming Flowcharts
To easily understand and analyze a program, flowcharts are handy. Though the use of programming flowcharts is increasing day-to-day, there are some advantages and disadvantages of using a flow chart. On occasions, the designs say that the most common drawback of programming flowcharts is their complicacy, and hence they are difficult to create. This hindrance has decreased as there are several online tools like EdrawMax, making it easier to produce programming flowcharts.
The Benefits of Programming Flowcharts:
- When it comes to understanding programming or a logical structure, programming flowcharts are the best way of working.
- When a designer is creating a program, there can be certain loopholes that can hinder the progress. To avoid that, they can design the app or website with programming flowcharts before working on them.
- The engineer working on the debugging process can look at the programming flowchart, making it easier to debug the program.
- For reviewing a program, the designer may need to look at the programming flowchart.
- They can analyze the program with the help of the logical diagram of the flowchart and then modify it as per their requirement.
- The engineers can also use flowcharts as a way of documenting their program correctly.
- As the programming flowcharts work as blueprints, it is time-efficient while creating a new program or application.
The Drawbacks of Programming Flowcharts:
- When it comes to complex programming, drawing the programming flowchart can be difficult for designers.
- As there is no standard of using details, the programming flowchart may confuse the individuals working.
- If the designer is trying to make a pre-existing programming flowchart or application, they may find it tough to reproduce.
- If an engineer tries to modify a flowchart based on modifying the said application or website, it can be challenging.
Flowchart Symbols
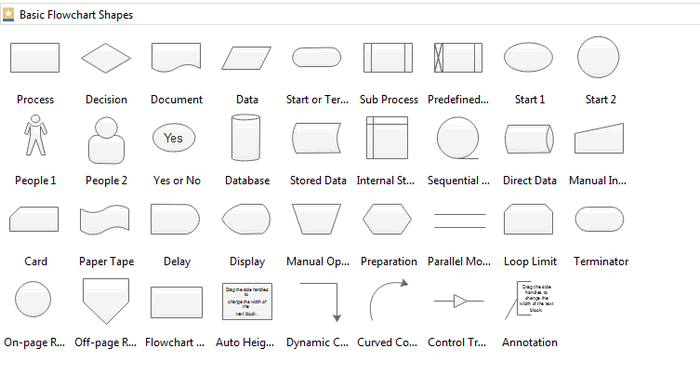
For creating a programming flowchart, the user needs programming flowchart examples. The flowcharts use diagrams to express an algorithm, and hence flow charts are very helpful in creating and analyzing the details of a program. The flow charts use some symbols that can explain the logic of programming connected with the flowchart elements. Here are some widely-used programming flowchart symbols
- Flow Line: This symbol works as a connector in a programming flowchart. This line shows the logical flow and relationship among the various steps or elements of the programming flowchart. The flow lines run between each step starting from the two terminals to denote the flow of logic.
- Terminal (Start/ Stop): The terminal symbols present in every programming flowchart as the process starts with a "start" command, and a "stop" command shows the end of the whole process on the flowchart. The example also has both the start and end symbols represented by a rectangular sign with curved edges to signify the beginning and end of a programming flowchart procedure.
- Input/ Output: The commands of Input and Output in operation are most crucial. To get a logical flow to go through the processing, the user needs to give input. The system reads the inputs to give an output. The symbols for inputs and outputs are parallelograms.
- Processing: For a process to complete successfully, the method must include the function of processing. The processing part occurs between the input and the output. The rectangle shapes represent the processing work.
- On-page connector: When there is a need to connect different flowlines, on-page connectors are present at the junction.
- Off-page connector: The off-page connectors connect different flowlines when they are present on separate pages.
- Decision: When there is a need to decide between true or false, this function gets used. The diamond-shaped symbols are useful when the function is taking a series of decisions to get the result.
- Predefined process/ function: When a group of some statements performs a predefined work, its representation occurs with this symbol.
- Document: This symbol denotes the printout or report.
Steps to Create
Though it may seem complicated to create a programming flowchart, online flowchart maker tools can quickly help the designs create a programming flowchart. Here are some easy steps that the designers and engineers can follow to create their flowcharts.
1)Find Out the Purpose of the Programming Flowchart
At first, the designers need to find out the purpose of the programming flowchart they are creating. When they decide the topic, they need to check the symbols useful for the programming flowchart. Since a flowchart analyses a logical connection, the engineers' symbols for making programming flowcharts can vary. Once the designers have finished deciding their theme, they can drag the library's symbols to their picture.
2) Pick Proper Symbols
As for the symbols, an engineer can pick several symbols as per their choice. They need to know the meaning of the symbols properly as they are working. Without the proper symbol, the engineer may fail to produce the whole programming flowchart. They also need to decide the chronological order of the working process by reviewing any pre-existing documentation of the step. They can also make a rough estimation of the tasks before creating an actual programming flowchart.
3)Plan the Shapes
The program design can include shorter texts and single keywords to make the flowchart look more concise and efficient. Moreover, it added a sense and preciseness while stylistically improving the programming flowchart's quality. They also need to sort the shapes by their type and use. For example, they can use symbols of input/ output or process, and for that, they need to plan the shapes.
4) Place the Shapes and Symbols
The designer can now place the shapes and symbols while working on the logic flow in a programming flowchart. There are some specific symbols to express a particular thing or function. Once the designer has finished lining out the program or applying the symbols, they must place the arrows to connect the shapes. To save time while preparing for programming software, the user can also click on the floating button.
5) Check the Logical Structure of the Flowchart
After finishing the whole flowchart, the designer must carefully go through the programming flowchart to determine if they have skipped any step that can disturb the programming flowchart's overall logic. The designer must check their work thoroughly as soon as they finish the logical structure of the flowchart. They must look for the bugs present in it so that when they will use it in the future for debugging, analysis or modification, the flaunty structure may not hinder the process.
Why EdrawMax for Programming Flowchart Making
When a designer is looking for an online tool to work on their programming flowcharts, they mainly concentrate on picking the user-friendly one. The process of programming flowchart is, in general, complicated in nature, therefore choosing an online tool that is good for an inexperienced user is very much preferable. They can use EdrawMax for better examples. Here are the reasons why EdrawMax is the best:
- User-friendly: For any online tool, it should be user-friendly to offer the best experience to the users. Inexperienced users can use EdrawMax because of its easy-to-use nature. They have several templates for the users to work on and modify as per their requirements. They also have libraries that have symbols that are significant to create a programming flowchart.
- Resource Centre: The EdrawMax tool comes with a resource center. If a user has some issues with their work or needs help while working on something, they can easily reach out to the application's resource center to help them with the issues.
- File Compatibility and Cross-platform support: The tool makes it easy for the user to export their work and share it with others. The tool supports various types of file formats, and hence the user can choose one as per their choice. At the same time, the tool is cross-platform supported. It can simultaneously work with other widely used platforms like Windows, Mac, Linux, Web, and more.
Programming Flowchart Examples
Here is an example of the programming flowchart that explains how the logic flow works in programming flowcharts. For example, a designer can record the process of adding two numbers to an application.
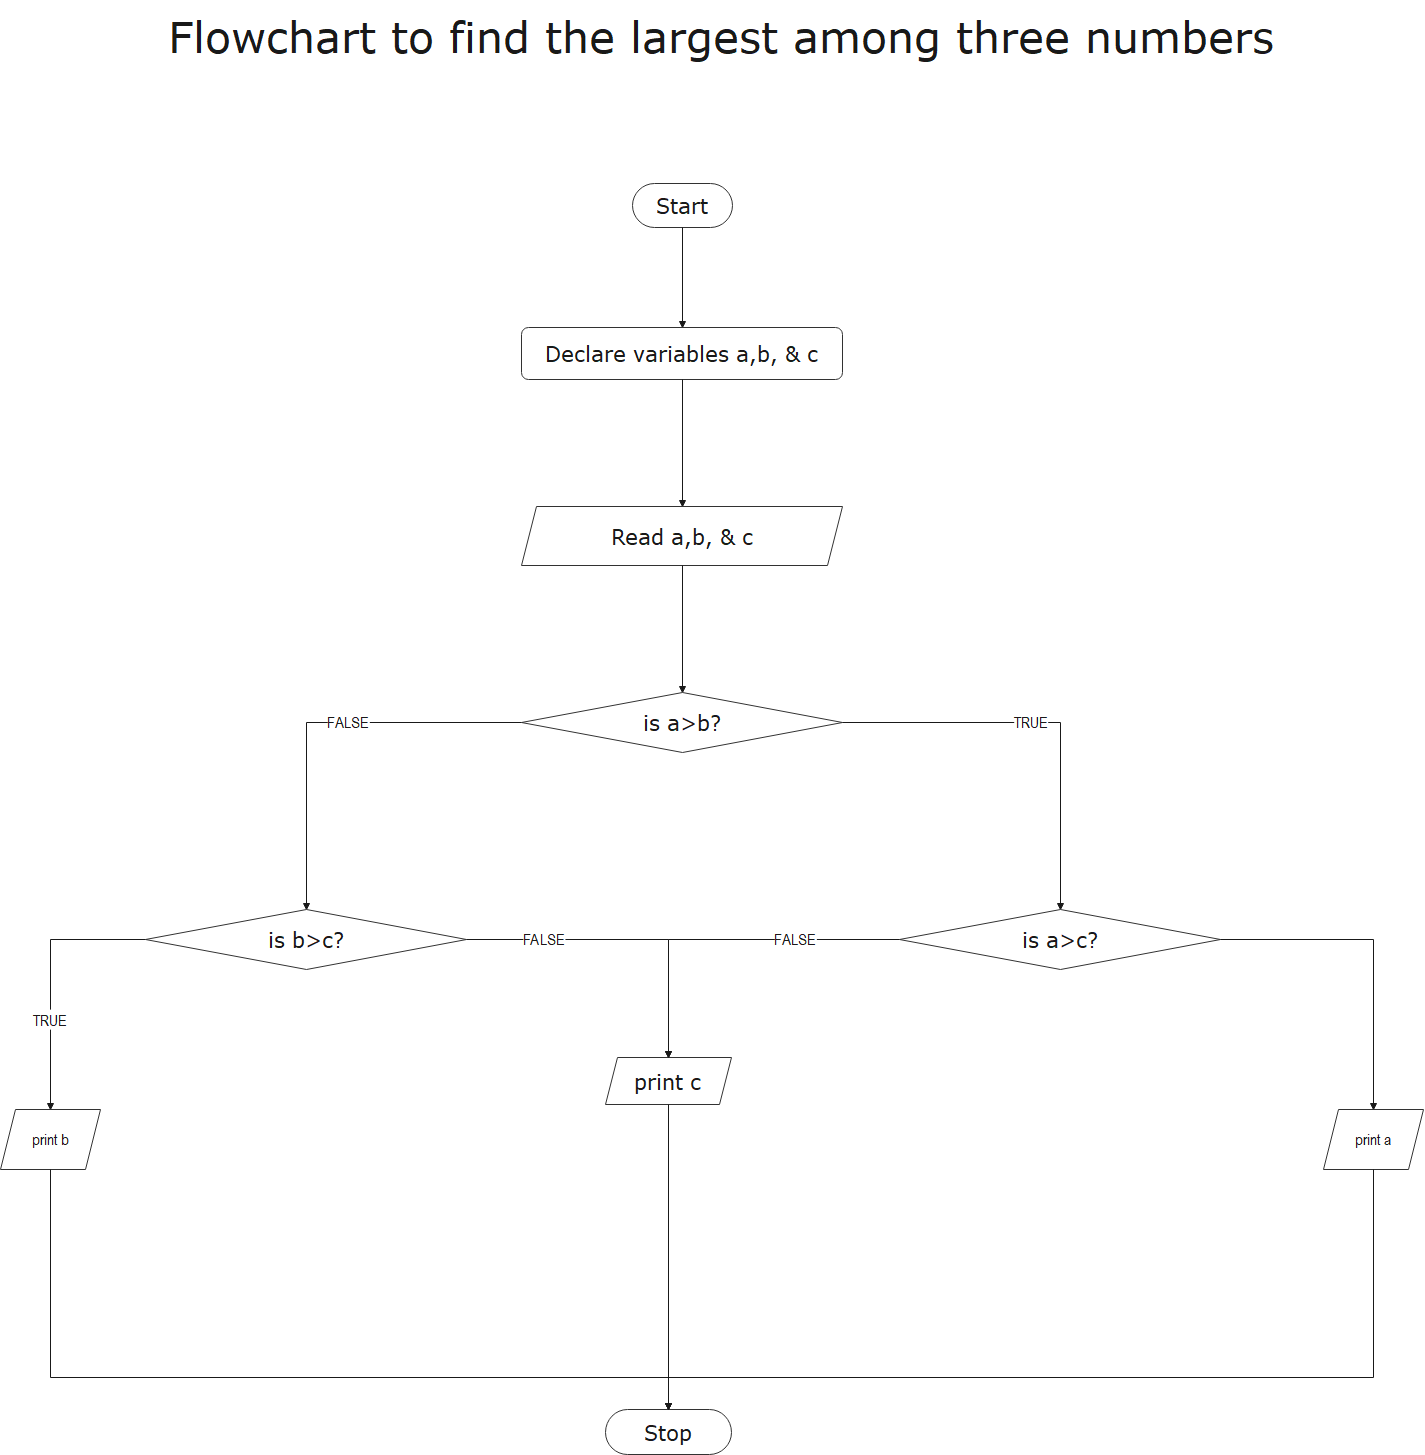
Finding the most significant number among the three numbers:
Programming flowchart: With the help of a programming flowchart, determining the most significant number becomes easy. The flow chart starts with a terminal name "start" and then gradually proceeds through the stage "declare variable a, b & c." The input for the program is "Read a, b & c." The process of decision-making takes on from this part. First, the logic flow determines if a is greater than b. If this is false, then it goes on to determine if b is greater than c. If it is true, then the given command is "print b." If b>c ends with the decision false, then "print c." If a>b is true on the first stage, then the command furthers with a>C. If the decision is true, then the command is "print c," and if it is false, then "print a." The whole process ends with the stop terminal.
Comparing the flowchart with other programming languages:
C
#include <stdio.h>
int main()
{
int A, B, C;
printf("Enter the numbers A, B and C: ");
scanf("%d %d %d", &A, &B, &C);
if (A >= B && A >= C)
printf("%d is the largest number.", A);
if (B >= A && B >= C)
printf("%d is the largest number.", B);
if (C >= A && C >= B)
printf("%d is the largest number.", C);
return 0;
}
C++:
// C++ program to find largest of two numbers
#include <iostream>
using namespace std;
int main()
{
int num1, num2, num 3largest;
/*Input two numbers*/
cout << "Enter three numbers:\n";
cin >> num1;
cin >> num2;
cin >> num3;
/*check if a is greater than b*/
if (num1 > num2)
largest = num1;
else
largest = num2;
if (num2 > num3)
largest = num2;
else
largest = num3;
/*Print the largest number*/
cout << largest;
return 0;
}
Java:
// Java Program to Find the Biggest of 3 Numbers
// Importing generic Classes/Files
import java.io.*;
class GFG {
// Function to find the biggest of three numbers
static int biggestOfThree(int x, int y, int z)
{
return z > (x > y ? x : y) ? z : ((x > y) ? x : y);
}
// Main driver function
public static void main(String[] args)
{
// Declaring variables for 3 numbers
int a, b, c;
// Variable holding the largest number
int largest;
a = 5;
b = 10;
c = 3;
// Calling the above function in main
largest = biggestOfThree(a, b, c);
// Printing the largest number
System.out.println(largest
+ " is the largest number.");
}
}
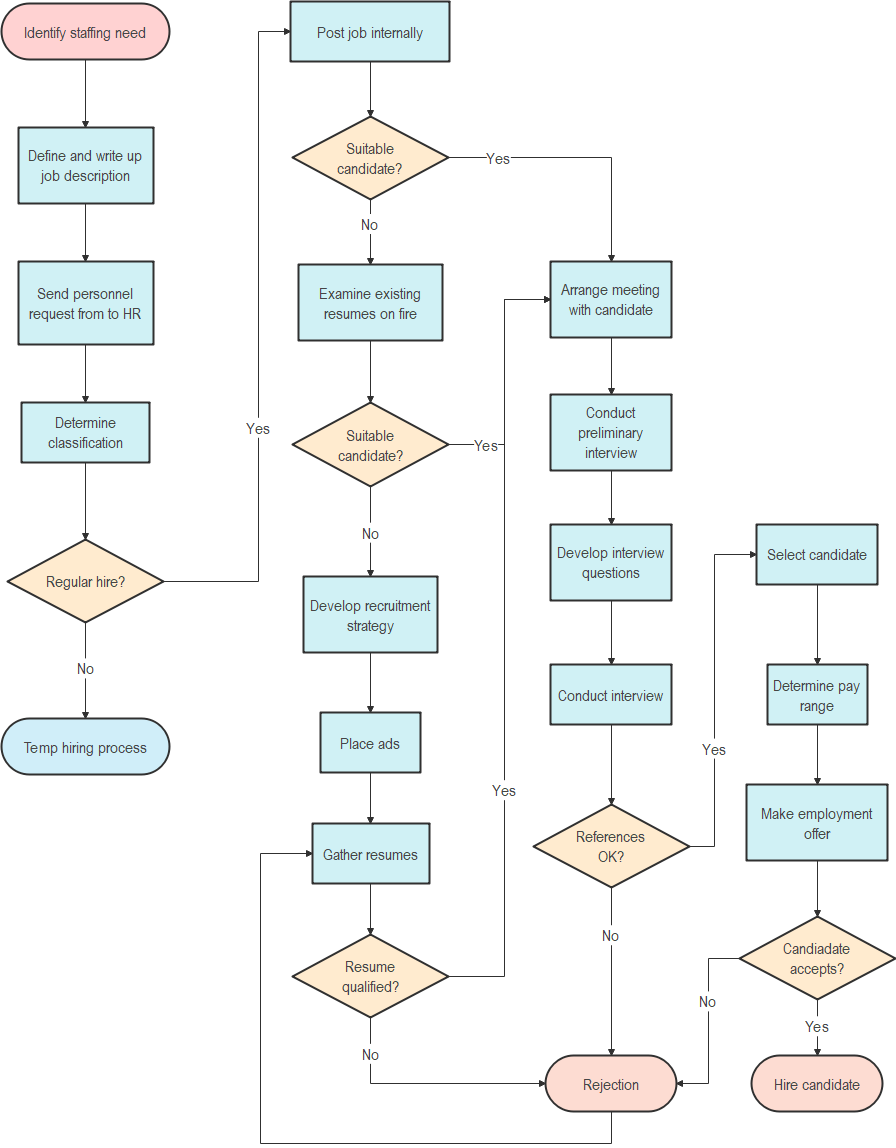
Hiring Flowchart:
Here is a programming flowchart that shows the hiring process that starts with "identifying staffing needs." The flowchart defines the job description, sending personal requests, which are a part of processing. In the diagram, several processings works land on the decisions with yes, no answers. For example, the decision to select suitable candidates continues to a yes and a no. If the answer is yes, then the process continues with arranging meetings and then having meetings. For the no answer, the company needs to look into the other resumes to find another suitable candidate. The whole flowchart ends with rejection or acceptance of the references or the candidates.
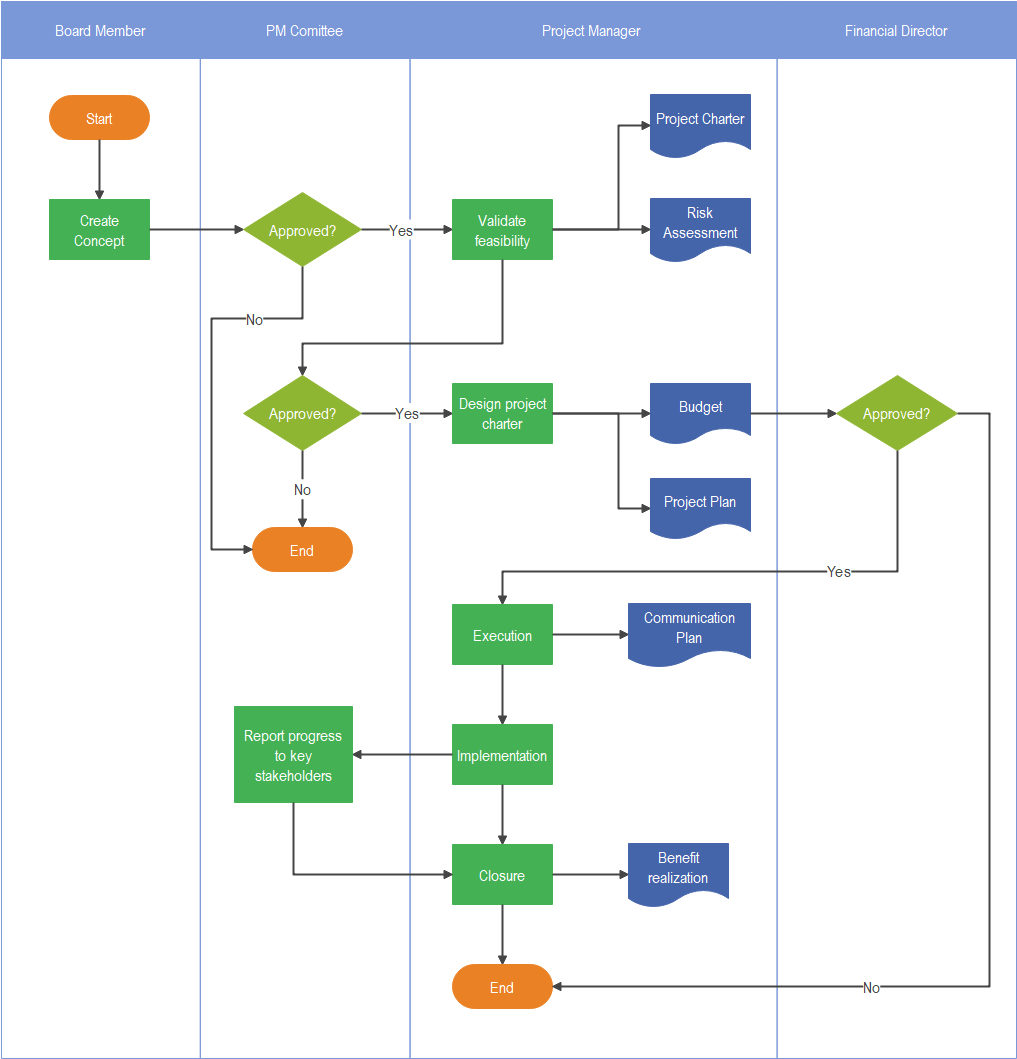
Project Flowchart:
The process starts and then continues with the concept, which is a part of processing. There can be two decisions. If it is a yes, then the project continues with validating the feasibility and creation of documents like project charter and risk assessment; with the project's continuation, the document like budget, project plans, communication plan develop. With the implementation of the project and benefits realization report, the project gets its "closure." The whole procedure completes with an "end" terminal.